WPF和Silverlight版Chart2D帮助文档
自定义坐标轴标注

在某些情况下,您可能需要创建自定义坐标轴标注。下面的场景中,创建自定义坐标轴标注会比较有用:

C#
拷贝代码
c1Chart1.Reset(true);
        c1Chart1.Data.Children.Add(
          new DataSeries() { ValuesSource = new double[] { 1, 2, 1, 3, 1, 4 } });
        c1Chart1.ChartType = ChartType.LineSymbols;
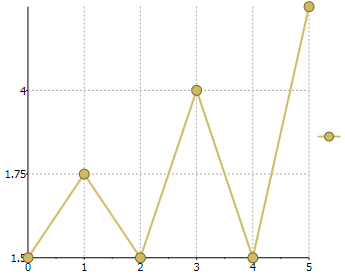
        c1Chart1.View.AxisY.ItemsSource = new double[] { 1.25, 1.5, 1.75, 4 };

下面是添加前面的代码后,该图表的外观:


C#
拷贝代码
c1Chart1.Reset(true);

        c1Chart1.Data.Children.Add(
          new DataSeries() { ValuesSource = new double[] { 1, 2, 1, 3, 1, 4 } });
        c1Chart1.ChartType = ChartType.LineSymbols;

        c1Chart1.View.AxisY.ItemsSource = new List<KeyValuePair<object,double>>
          { new KeyValuePair<object,double>("Min=1", 1),
            new KeyValuePair<object,double>("Average=2.5", 2.5),
            new KeyValuePair<object,double>("Max=4", 4)};

下面是添加前面的代码后,该图表的外观:


C#
拷贝代码
c1Chart1.Reset(true);

        Point[] pts = new Point[] { new Point(1, 1.3), new Point(2, 2.7), new Point(3, 3.9) };
        c1Chart1.DataContext = pts;
        c1Chart1.ChartType = ChartType.LineSymbols;

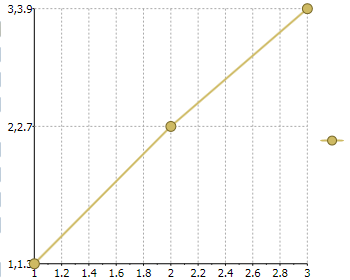
        c1Chart1.View.AxisY.ItemsSource = pts;
        c1Chart1.View.AxisY.ItemsValueBinding = new Binding("Y");
        c1Chart1.View.AxisY.ItemsLabelBinding = new Binding();

下面是添加前面的代码后,该图表的外观:


查看其它


产品网站:http://www.gcpowertools.com.cn  |  咨询热线:4006576008   |   ©2015 西安葡萄城